Analytics & reporting
A reporting bot that turns your warehouse into one-tap dashboards. /report pulls KPIs, /chart returns a PNG, and a daily 9am summary is auto-posted to your management channel. SQL or REST data sources both supported.
A clear, line-by-line scope.
Every Analytics & reporting build covers these capabilities at minimum. Anything beyond is scoped during your brief.
On-demand /report
Type /report revenue 7d and the bot returns the KPI block with deltas vs prior period.
Scheduled summaries
A daily / weekly / monthly summary post to a management channel, with the metrics you choose.
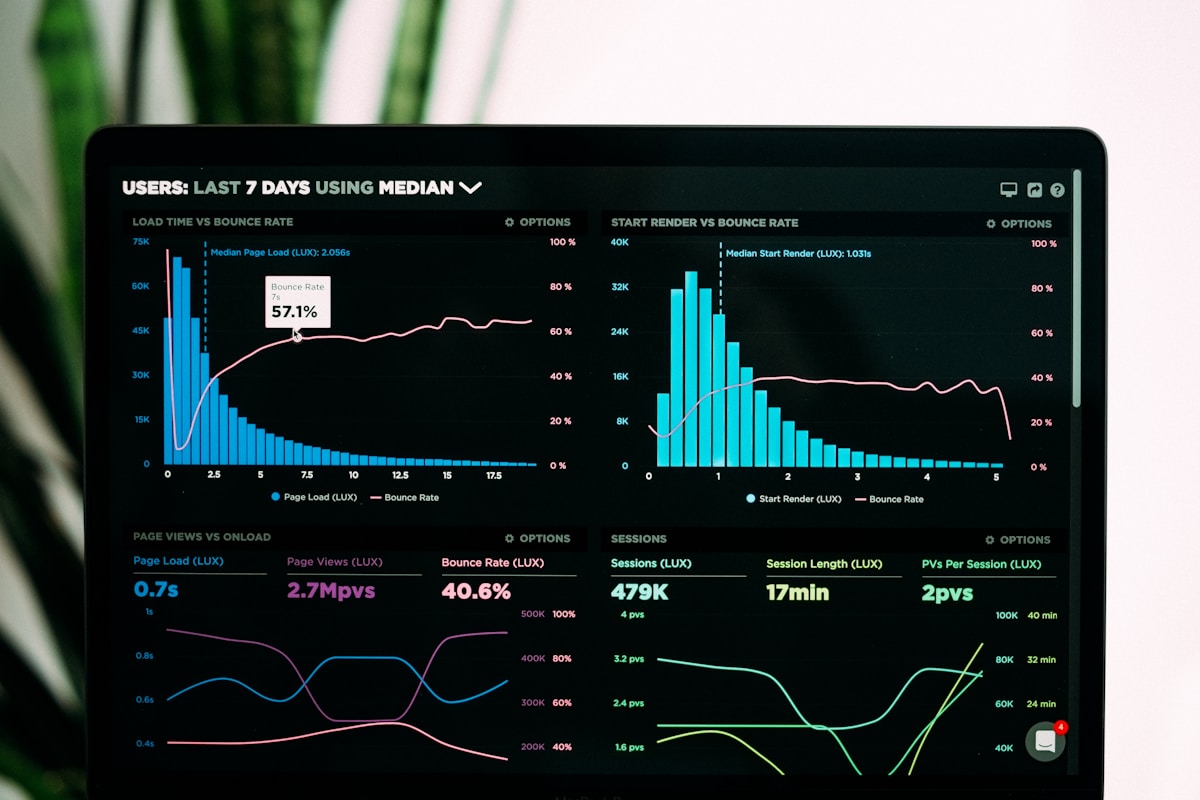
PNG chart exports
/chart sales 30d returns a rendered PNG using matplotlib or QuickChart — share-ready.
Pluggable sources
Read from Postgres / MySQL / BigQuery / Snowflake or hit any REST endpoint you own.
Python stack pairs naturally with pandas and matplotlib for charts.
Persistent scheduler and credential storage.
Health pings for the scheduler and data-source connectivity.
Ready to brief us on a analytics & reporting bot?
Pick a plan and the order page opens automatically — your engineer is assigned within hours.